 Overview of Voltage Sag
With the rapid development of the modern power industry and significant changes in load structures, the dependence of industrial and office automation on electronic equipment has increased significantly. As a result, voltage sag has become a major concern for power users. During the transmission of electricity over wide geographical areas, the power system is frequently exposed to disturbances such as lightning, storms, strong winds, construction activities, and human errors. These factors can lead to short-circuit faults and voltage sag events, some of which can seriously affect the normal operation of sensitive equipment.
In modern power systems, voltage sag and swell are among the most common power quality issues. Abnormal increases in RMS voltage can directly damage equipment. Voltage sags that cause equipment failure or shutdown occur more than ten times as frequently as complete grid outages. According to data from the Electric Power Research Institute (EPRI), over 92% of power quality events are related to voltage sag and swell, while other events account for less than 8%. Voltage sag is widely recognized as the most frequent disturbance in power systems, making protection of sensitive equipment against sag (and swell) critically important.
iKonMac Technology provides comprehensive voltage sag solutions, including mitigation strategies, power quality monitoring, and data analysis, effectively reducing economic losses and production downtime caused by voltage disturbances.
 What is Voltage Sag
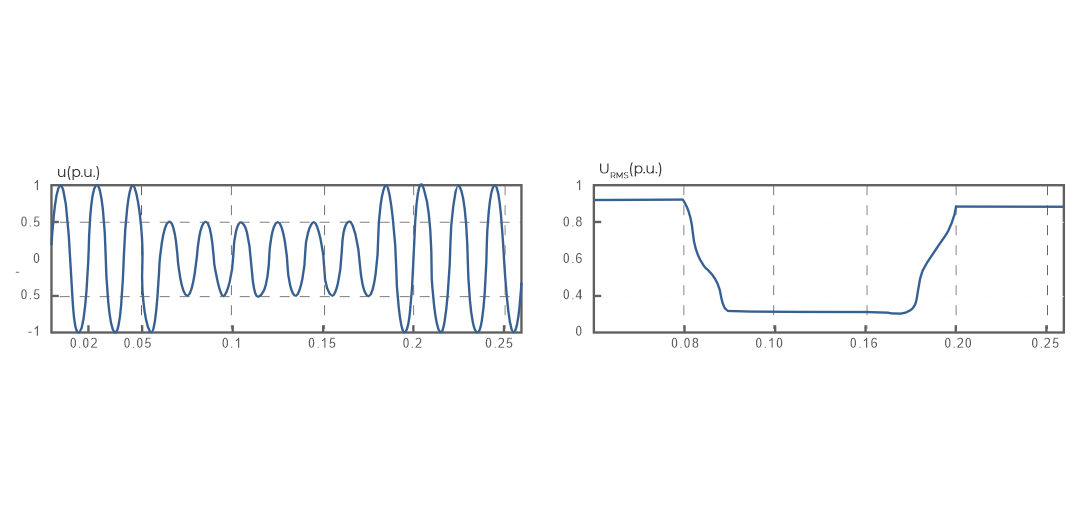
According to IEEE standards and the national standard “Power Quality—Voltage Sag and Short Interruption” (GB/T 30137-2013), a voltage sag is defined as a temporary reduction in the RMS value of the power frequency voltage at a certain point in the power system to 10%–90% of the rated voltage (i.e., 0.1–0.9 p.u.), lasting from 10 ms to 1 minute, after which the voltage returns to normal levels while the system frequency remains unchanged. Voltage sag is measured by the percentage of the remaining voltage. A short interruption refers to a condition where the voltage of one or more phases drops instantaneously below 0.1 p.u., with a duration of 10 ms to 1 minute.
 Causes of Voltage Sag
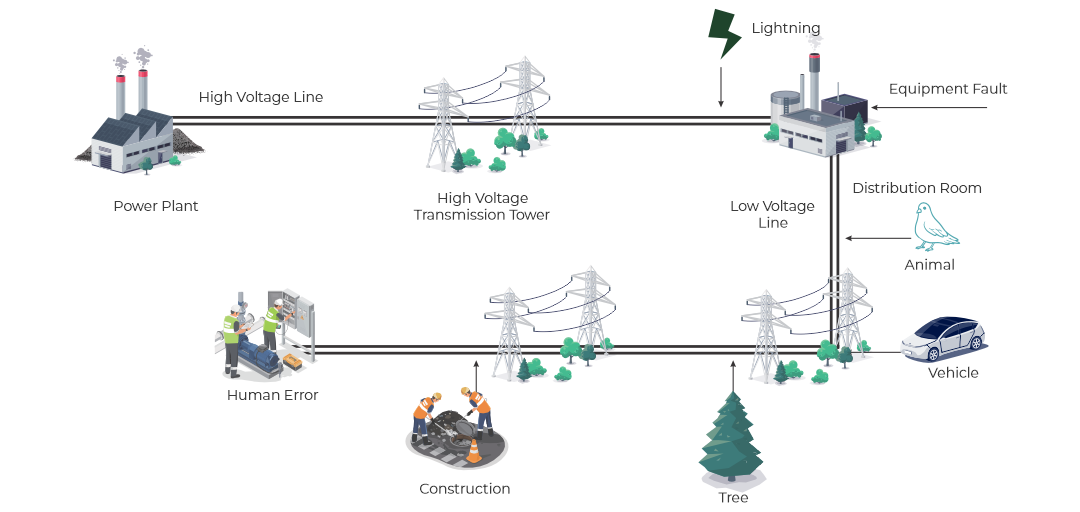
Voltage sag is generally caused by faults in the power grid or substation equipment, or by sudden large changes in load. During long-distance power transmission, electricity inevitably encounters various conditions, such as power system faults in transmission and distribution systems, lightning, large motor starting, and switching of capacitors.
Lightning, thunderstorms, heavy rain, strong winds, snow, etc.
Short-circuit faults, large motor starting, line switching, transformer and capacitor switching, and startup of high-power motors in distribution equipment.
Traffic accidents, construction damage to transmission lines, human operational errors, intrusion of small animals into substations, etc.
 Characteristics of Voltage Sag Events
The characteristics of voltage sag events can be summarized as follows:

Voltage sag duration typically < 2s

Single-phase and two-phase sags are more common.

Three-phase voltage below 20% is rare, but still occurs occasionally.
The figure below shows EPRI’s investigation of voltage sag events. Based on two power quality studies conducted at 22 sites across the Americas, a total of 1,076 voltage sag events were recorded. Among them, 93% were above the SEMI curve (green line), only 6 events were interruptions, and only 3 events lasted longer than 2 seconds.
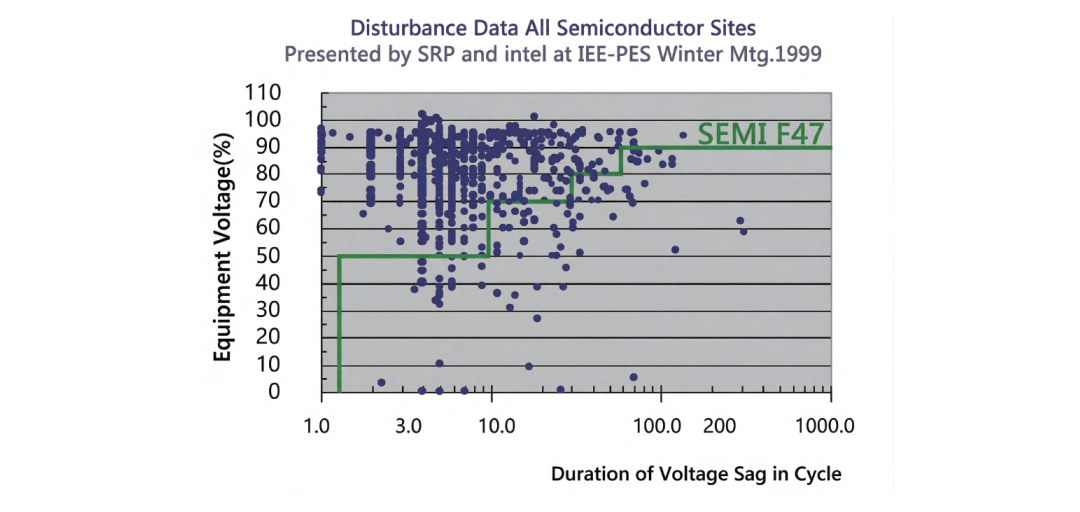
The figure below shows EPRI’s investigation of voltage sag events. Based on two power quality studies conducted at 22 sites across the Americas, a total of 1,076 voltage sag events were recorded. Among them, 93% were above the SEMI curve (green line), only 6 events were interruptions, and only 3 events lasted longer than 2 seconds.
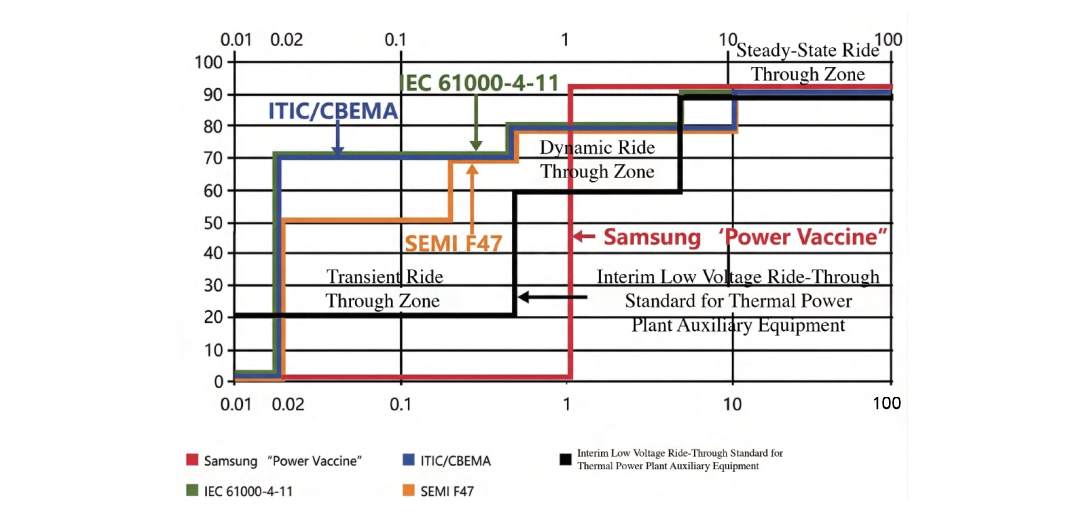
Note: Electrical equipment is immune to voltage sags above the curve and not immune to those below the curve.
 Key Parameters of Voltage Sag
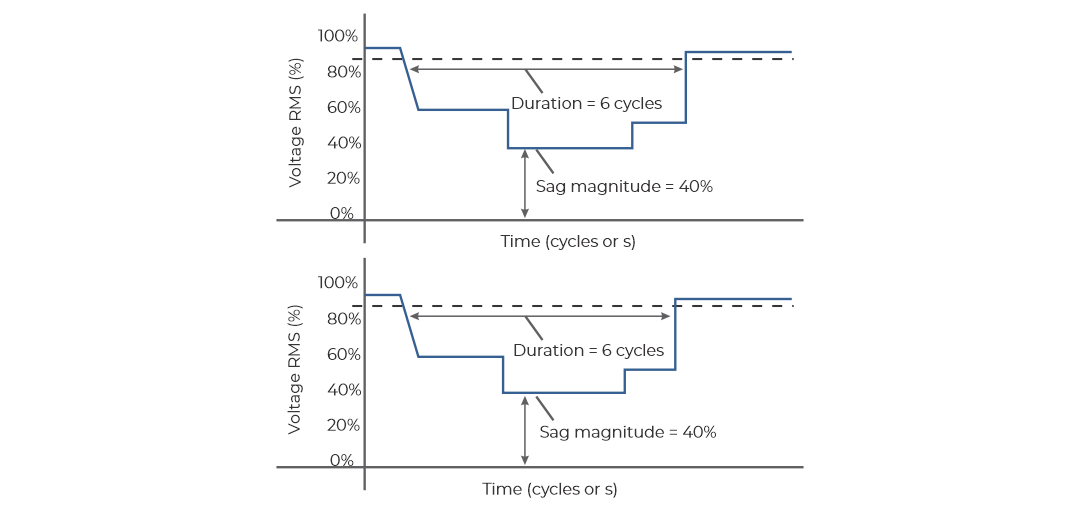
Defined as the ratio of the RMS voltage during the sag to the rated RMS voltage
Defined as the time from the start to the end of the sag
Defined as the number of voltage sag events occurring within a unit time (typically one year for evaluation)
 Impact of Voltage Sag
The impact of voltage sag depends on the industry and the type of load. The table below shows the sensitivity of some equipment to voltage sag:
| Equipment Name | Impact |
|---|---|
| Refrigeration Equipment Electronic Controller | When voltage drops below 80%, the controller disconnects the refrigeration motor |
| Semiconductor Manufacturing | When voltage drops below 85%, electronic circuits in testing and processing equipment may fail, causing shutdown |
| PLC | When voltage drops below 90% for several cycles, I/O devices may malfunction; below 81%, the PLC stops operating |
| Precision Machine Tools | When voltage drops below 90% for 2–3 cycles, robot control operations are interrupted |
| DC Motor | When voltage drops below 80%, motor protection trips |
| Variable Speed Drive | When voltage drops below 70% for more than 6 cycles, the VSD will trip; in some precision industries, motors may trip if voltage drops below 90% for more than 3 cycles |
| AC Contactor | When voltage drops below 50%–70% for more than one cycle, the contactor will drop out automatically |
| Computer | When voltage drops below 60% for 12 cycles, the computer will shut down |